 with Glue Up's Analytics Dashboard")
As you strive to optimize your organization's performance and make data-driven decisions, tracking and analyzing Key Performance Indicators (KPIs) has become increasingly crucial.
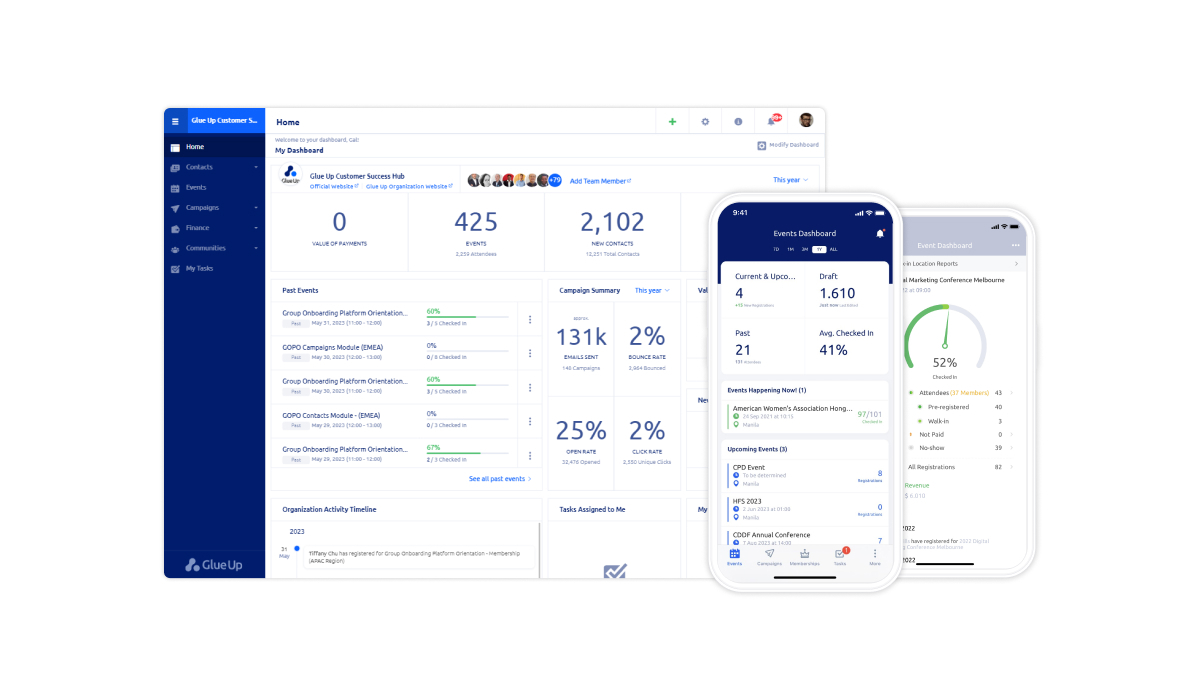
Analytics dashboards, such as the one provided by Glue Up, are powerful tools designed to help associations monitor and measure various KPIs related to events, membership activities, and community engagement.
Read on to explore how your association can leverage analytics dashboards to gain valuable insights and drive success.
Key Takeaways
- Glue Up's analytics dashboard is a powerful tool designed for associations and other membership organizations, providing comprehensive coverage of essential areas like events, membership, community engagement, and email campaigns.
- Membership analytics help drive growth and retention by tracking metrics such as total members, new members, churned memberships, renewal rates, and financial indicators like membership dues and pending revenue from applications and renewals.
- Event analytics enable associations to maximize event success by monitoring attendance metrics, revenue and expense data, and profit/loss, allowing for data-driven optimization of future events.
- Community analytics foster engagement by providing insights into activity levels, sentiment analysis, top-performing content, and content reach, empowering associations to build stronger relationships with members.
- Email analytics optimize campaign performance by tracking key metrics like bounce rates, open rates, click rates, hard bounces, recently sent campaigns, suppressed emails, and unsubscribes, facilitating data-driven improvements to email marketing strategies.
Why Glue Up's Analytics Dashboard?
When it comes to robust analytics, you’ll find several technology solutions to choose from. However, Glue Up has an edge as the all-in-one AI-powered AMS.
Since it’s the only global tool available in the market with comprehensive functions including AI, automation, and apps, it can bring all your data into one place, a capability missing in other similar association management software.
Furthermore, it also consolidates the data from all your chapters, providing a bird's-eye view of your organization.
Here are some other reasons why Glue Up's analytics dashboard stands out:
- Tailored to Associations: Glue Up's analytics dashboard is built with associations in mind, providing a wide range of KPIs and metrics that are specifically relevant to the needs of associations.
- Comprehensive Coverage: The dashboard covers all essential areas of association management, including events, membership, community engagement, and email campaigns, providing a holistic view of your organization's performance.
- User-Friendly Interface: It features an intuitive and user-friendly interface, making it easy for you to navigate and access the insights you need.
- Real-Time Data: The dashboard provides real-time data and updates, allowing you to make informed decisions based on the most current information available.
Driving Membership Growth and Retention with Glue Up's Membership Analytics
Membership analytics provide valuable insights into the growth and retention of your members.
By tracking membership growth metrics, renewal metrics, engagement metrics, and financial metrics, you can assess the effectiveness of your membership strategies and make informed decisions to drive growth and improve retention rates.
Membership Growth Metrics
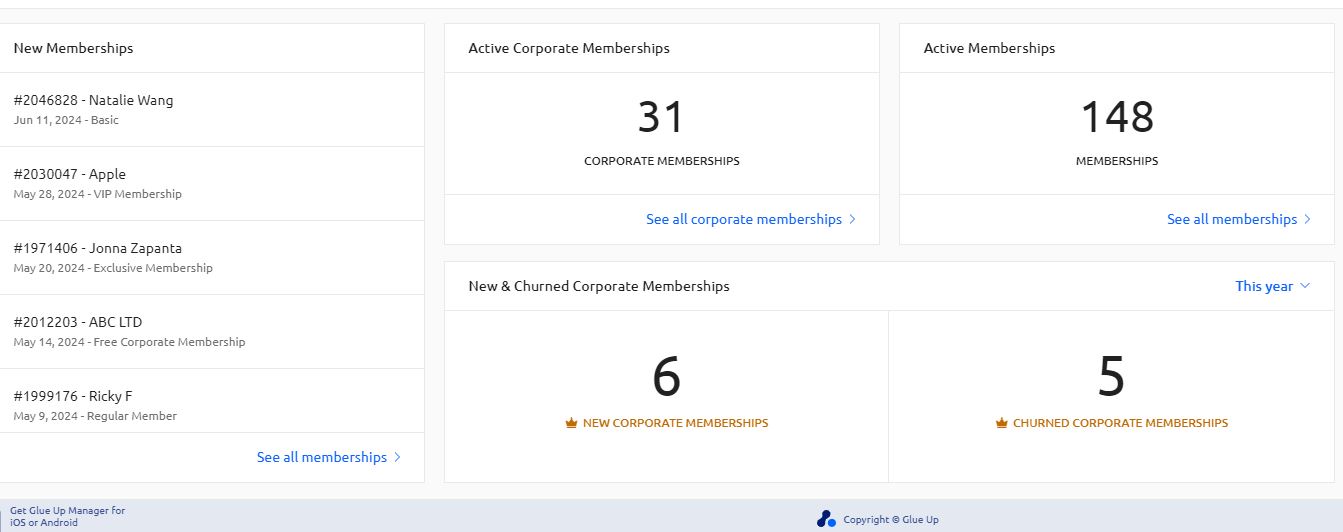
The membership growth dashboard provides a comprehensive overview of your organization's membership acquisition and retention performance.
It presents the key metrics in a visually intuitive format, so you can quickly assess the effectiveness of your membership sales strategies and identify trends that may impact your organization's growth.
The dashboard includes the following essential metrics:
- Total Members: The total number of active members in your organization.
- New Members: New members who joined within a specific period.
- Active Members: Number of all active members who are part of individual and corporate memberships.
- Active Memberships: The total number of your active memberships, including the ones in your chapter organizations.
Renewal Metrics
Membership retention is equally important as acquisition.
Glue Up's analytics dashboard tracks your renewal metrics, helping you identify factors that contribute to member retention and develop strategies to reduce churn.
Thus, by closely monitoring renewal trends and proactively addressing potential challenges, you can foster a loyal and engaged membership base.
The dashboard focuses on the following key renewal metrics:
- Churned Memberships: The number of memberships that have not been renewed within a specified period.
- Recently Renewed Memberships: Sum of memberships that have been successfully renewed within a recent timeframe, such as the past month or quarter.
- Renewal Health Check: The percentage of members who renew their membership at the end of their term. It also includes the average time to renew during your selected time frame.
Financial Metrics
Monitoring financial metrics helps you assess the financial health and sustainability of your membership program. Here are some key metrics you can view on Glue Up’s dashboard:
- Membership Dues: The total revenue generated from membership dues.
- Value of Applications Awaiting Payment: Highlights the potential revenue that is pending from membership applications that have been submitted but have not yet been paid for.
- Value of Renewals Awaiting Payment: Focuses on the potential revenue from membership renewals that have been initiated but have not yet been paid for.
Maximizing Event Success with Glue Up's Event Analytics
Event analytics provide a comprehensive view of your event performance, enabling you to track and analyze various metrics.
Here are key valuable metrics you can track to measure the success of your events and make strategies for optimizing future events.
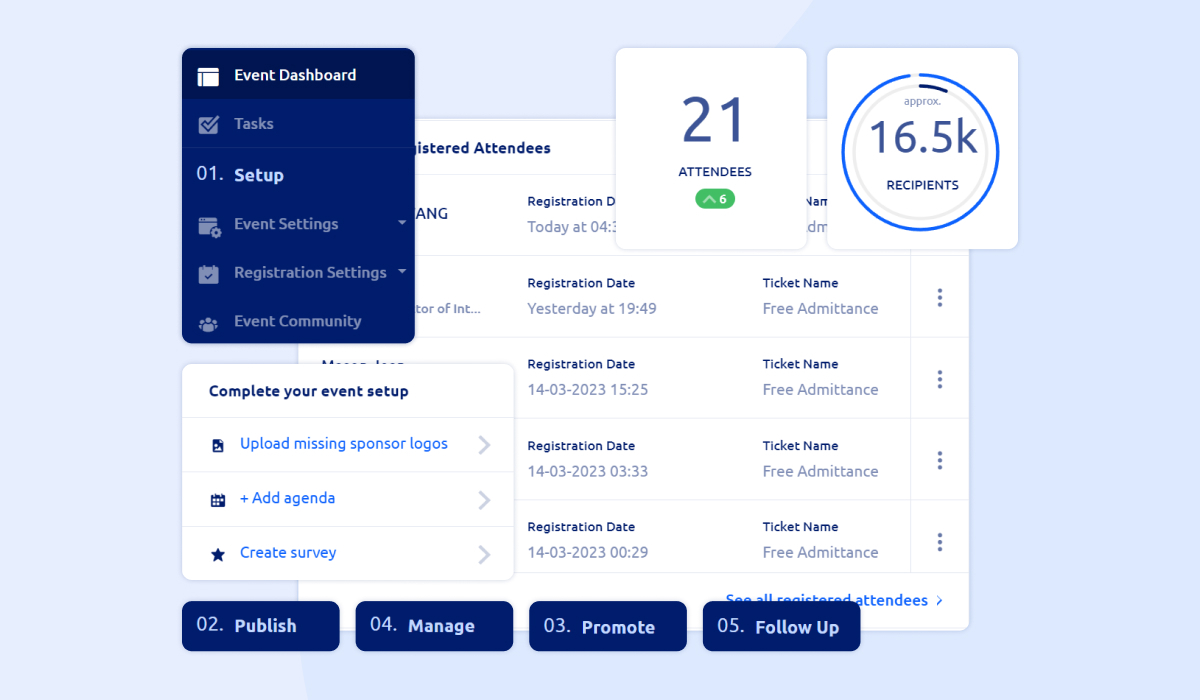
Attendance Metrics
Attendance metrics are crucial for evaluating the success of your events.
Glue Up's dashboard displays key attendance metrics, helping you understand the actual participation and engagement levels of your attendees.
You can compare these metrics across different events, you can identify factors that contribute to higher attendance, and make necessary adjustments to improve your future events.
- Total Attendees: The total number of attendees who registered for the event.
- Average check-in: The percentage of registered attendees who checked in at the event.
Revenue Metrics
Monitoring revenue metrics allows you to assess your events’ ROI. Here’s how Glue Up’s dashboard helps you in determining the outcome of your event in monetary terms.
- Total Revenue: The total income generated from your event and any other revenue streams.
- Total Expense: All costs associated with organizing and running the event.
- Profit and Loss: Comprehensive view of your event's financial performance by calculating the net profit or loss.
Optimizing Email Campaigns with Email Analytics
Email analytics provide valuable insights into the performance of your email campaigns.
By tracking campaign summary metrics, hard-bounced emails, and recently scheduled and unsubscribed emails, you can assess the effectiveness of your email marketing strategies and make data-driven decisions to optimize your campaigns.
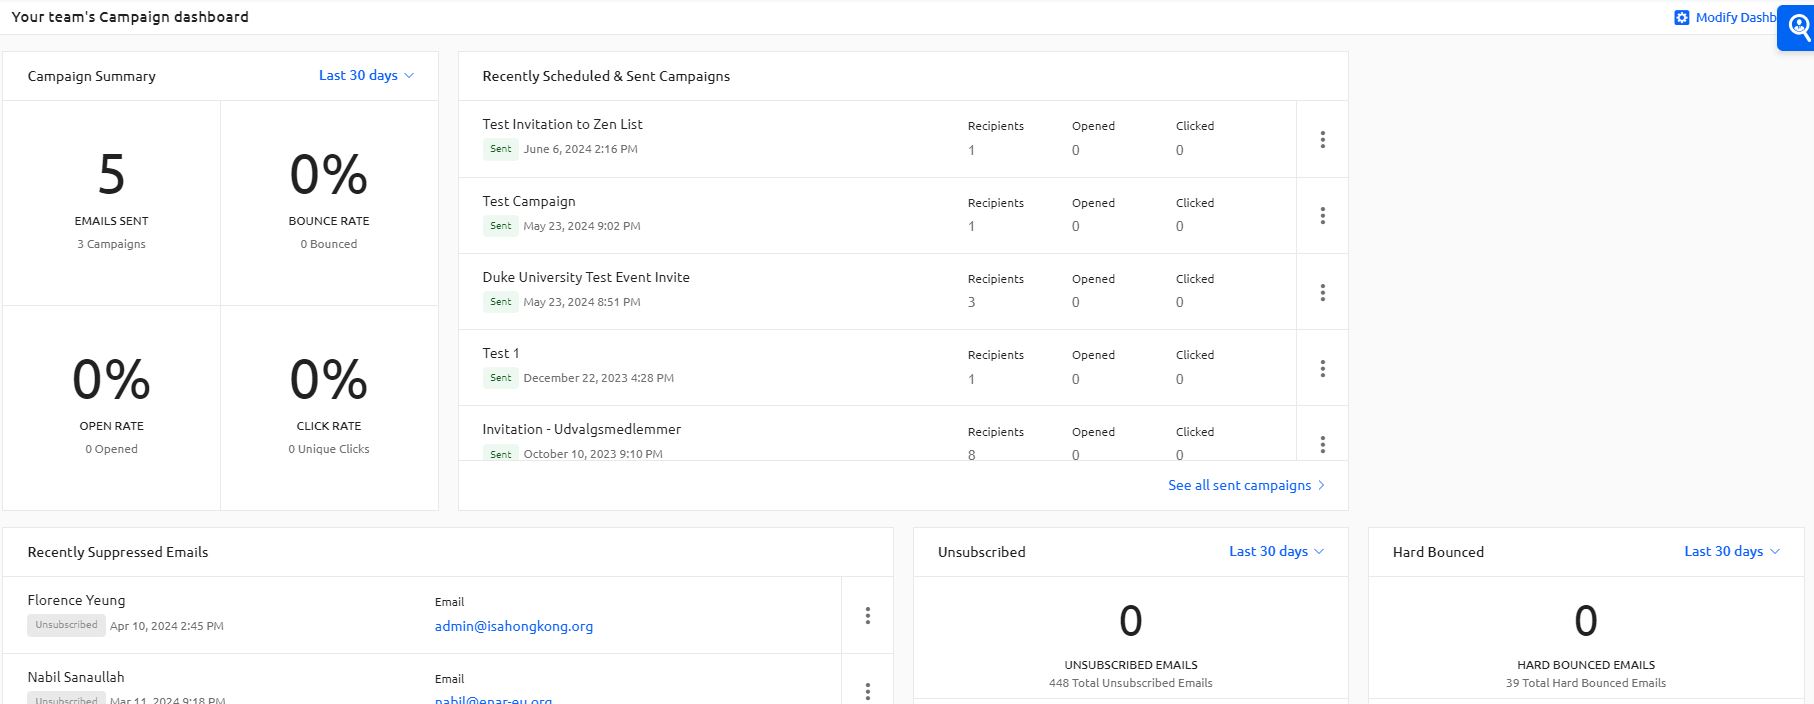
Campaign Summary
- Emails Sent: The total number of emails sent during your selected time frame.
- Bounce Rate: The percentage of emails that bounced and were not delivered to recipients.
- Open Rate: The percentage of recipients who opened your email campaign.
- Click Rate: The percentage of recipients who clicked on links within your email campaign.
Hard Bounced Emails
- Number of Hard Bounced Emails: The number of email addresses that hard bounced when your organization sent a campaign during your selected time frame.
Recently Scheduled & Sent Campaigns
- Campaigns Recently Scheduled and Sent: An overview of the email campaigns that were recently scheduled and sent by your organization.
Recently Suppressed Emails
- Email Addresses Recently Suppressed: The number of email addresses recently unsubscribed or bounced from your organization's campaigns.
Unsubscribed Emails
- Number of Unsubscribed Emails: The number of email addresses that unsubscribed from your organization's campaigns during your selected time frame.
Fostering Engagement with Community Analytics
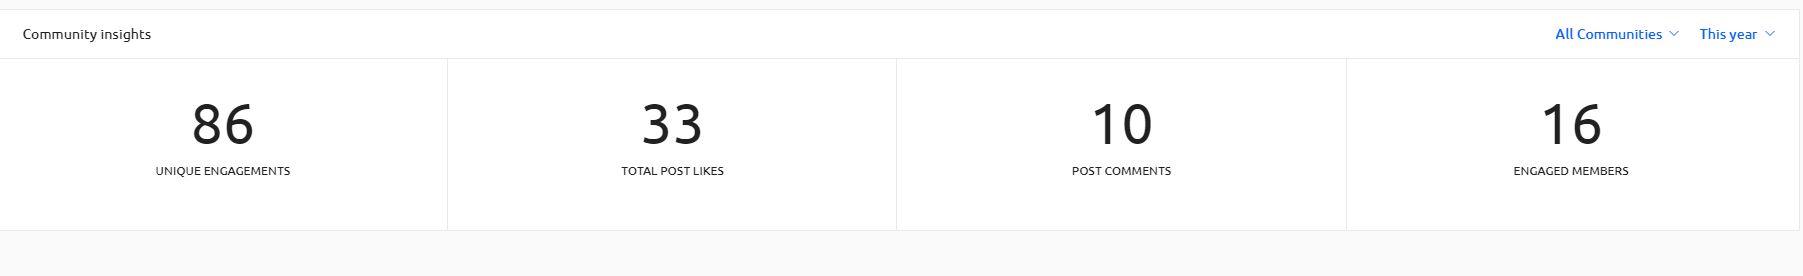
Glue Up's analytics dashboard empowers you with the data and insights needed to understand your community's dynamics, identify areas for improvement, and implement strategies to enhance engagement.
The dashboard focuses on the following key metrics:
- Total Post Likes: The total number of likes received on all posts within your community platform.
- Total Comments: Measures the number of comments made on posts.
- Engaged Members: Sum of members who have actively participated in your community within a specified period.
- Unique Engagements: Sum of distinct engagement actions taken by community members.
Customizing and Automating with Glue Up's Advanced Features
Glue Up's analytics dashboard offers you a customizable dashboard to view your KPIs and automate your reporting processes.
These segmented analytics enable you to analyze data by different demographics, membership levels, or event types, providing you with more granular insights.
Furthermore, you can integrate Glue Up's analytics dashboard with other tools, such as Quickbooks and Xero, allowing you to enhance data accuracy, and consistency, and gain broader insights.
To see how Glue Up's analytics dashboard can help your association succeed, get a demo today and learn how Glue Up can support your association's unique needs and goals.


